Official Website
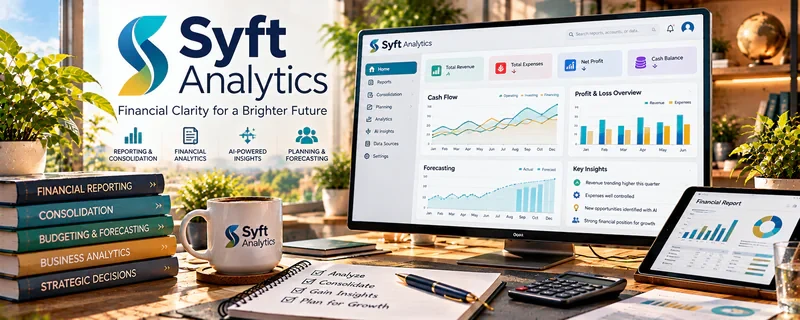
Syft Analytics is a reporting and financial analysis tool for building dashboards and KPI reports from accounting data.
🔗 Visit Official Website — Syft Analytics
Domain: www.syftanalytics.com
What This Website Is
Syft Analytics is a reporting and financial analysis tool for building dashboards and KPI reports from accounting data. For 📊 Online Bookkeeping, it helps you package monthly reporting and performance insights as a higher-value service.
How to Apply It to 📊 Online Bookkeeping
Use authorized accounting data to prepare clear client reporting. Validate the source records, permissions, and reporting definitions before drawing conclusions.
Step-by-Step Implementation:
- Connect client accounting data.
- Build a standardized dashboard template (cash flow, expenses, AR/AP).
- Use the dashboard in monthly review calls.
- Turn insights into recommendations (pricing, spend control, collections).
When to Use This
- When clients want more than bookkeeping cleanup.
- During month-end reporting.
- When selling advisory packages.
- When standardizing reports across clients.
Best Research Tasks to Use It For
- Financial KPI reporting
- Cash flow and expense trend analysis
- Client dashboard creation
- Variance and performance reporting
- Advisory insight preparation
Key Signals to Look For
- Cash flow changes across months.
- Expense categories growing faster than revenue.
- Late invoices or collection issues.
- Margin compression.
- Recurring patterns that become advisory recommendations.
Getting Started Steps
- Connect one client’s accounting data.
- Build a basic dashboard template.
- Add cash flow, revenue, expenses, and AR/AP views.
- Use the dashboard in a monthly review.
- Turn one insight into a recommendation or upsell.
Good Beginner Search Terms
- Syft Analytics bookkeeping dashboard
- financial KPI reporting for bookkeepers
- advisory dashboard accounting clients
Monetization Angle
Syft helps bookkeepers move from transaction work to reporting and advisory packages, which can support higher retainers and better client retention.
Pros
- Strong financial reporting workflows.
- Professional client-facing dashboards.
- Supports advisory upsells.
Cons
- Paid and advanced.
- Requires clean accounting data.
- Setup may be too much for very small clients.
Who Should Use This
Bookkeepers who want to package reporting, KPI dashboards, and advisory insights for clients.
Who Should Skip This
Skip if clients only need basic categorization and reconciliations.
Practical Applications
- Connect only authorized accounting data for a defined reporting purpose.
- Build a simple dashboard with documented metric definitions.
- Reconcile reported figures with the source ledger before sharing analysis.
Important Considerations
- A polished dashboard does not correct inaccurate books or establish the meaning of a KPI.
- Verify current integrations, access permissions, data processing, and pricing, and avoid giving regulated advice beyond your qualifications.
Related Resources
Looker Studio — flexible free dashboarding
Looker Studio — broader reporting reference and dashboard structure
Related Side Hustles
 Consulting: Get Paid for What You Know — advisory add-ons using KPI dashboards
 Newsletter Monetization: Get Paid to Write About What You Love — report sponsor and list growth metrics
 Social Media Management — KPI reporting for clients