Official Website
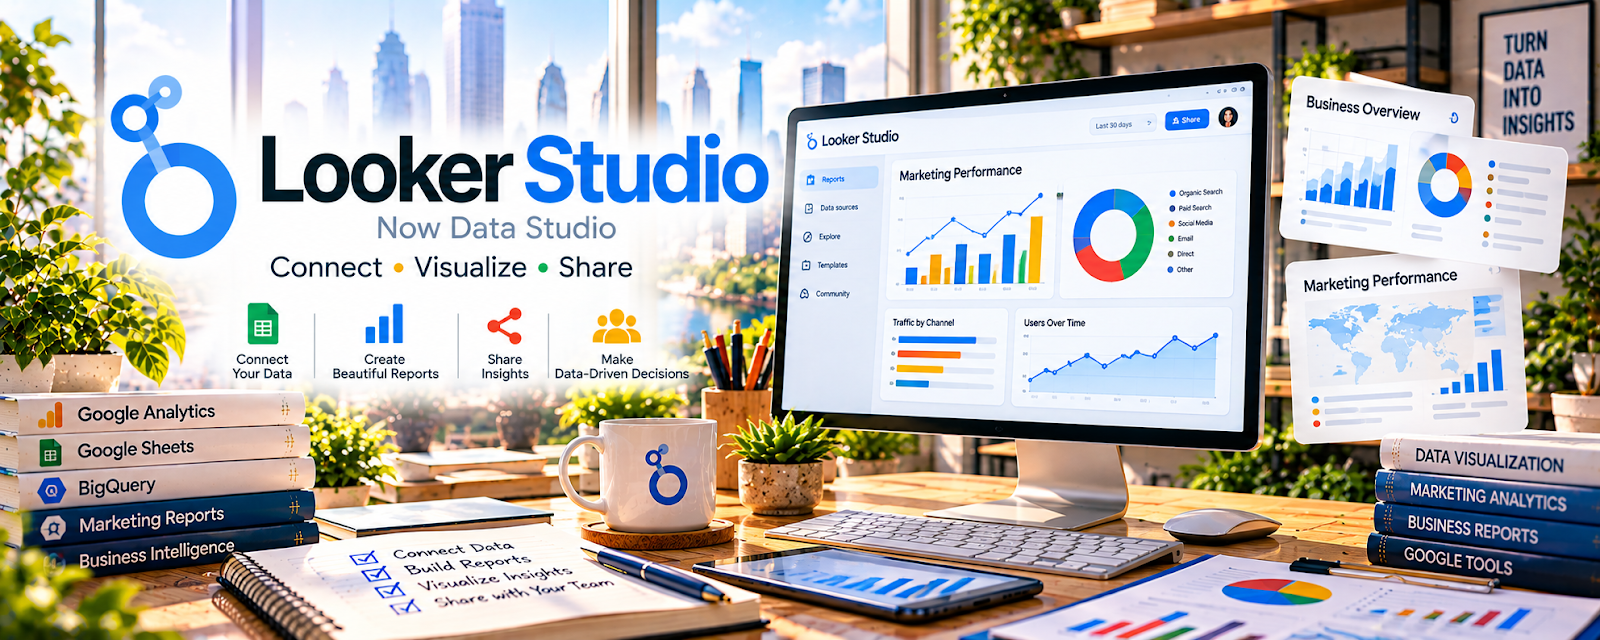
Looker Studio is Google’s free reporting and dashboarding tool.
🔗 Visit Official Website — Looker Studio
Domain: lookerstudio.google.com
What This Website Is
Looker Studio is Google’s free reporting and dashboarding tool. For 📊 Online Bookkeeping, it helps you turn client financial/ops data (from spreadsheets, exports, and tools) into simple dashboards you can use for monthly reporting, trend tracking, and client communication.
How to Apply It to 📊 Online Bookkeeping
Use Looker Studio to package insights as a service.
Step-by-Step Implementation:
- Define the KPIs clients care about (revenue, expenses, cash runway, AR/AP).
- Connect data sources (Sheets exports, accounting exports).
- Build a monthly dashboard template.
- Use the dashboard to drive recurring review calls and upsells.
Common use cases:
- Monthly bookkeeping reporting dashboards
- Cash flow trend reporting
- Client-facing financial summaries
When to Use This
- When clients want ongoing reporting.
- During month-end close reviews.
- When standardizing reporting across multiple clients.
- When you want to upsell advisory add-ons.
Best Research Tasks to Use It For
- KPI dashboarding for clients
- Trend analysis across months
- Variance reporting (month-over-month)
- Visual summaries for client communication
- Reporting template standardization
Key Signals to Look For
- Performance patterns: revenue/expense trends over time.
- Pricing signals: rising costs or margin compression.
- Conversion indicators: invoice aging and collection patterns (if tracked).
- Trend direction: recurring issues that require process fixes.
- Content gaps: missing data that prevents clear reporting.
Getting Started Steps
- Build a template: Overview, Cash Flow, Expenses, AR/AP.
- Connect Sheets data or monthly exports.
- Add a monthly scorecard.
- Use it in a recurring client review.
- Improve one section each month.
Good Beginner Search Terms
- Looker Studio dashboard for bookkeeping
- cash flow dashboard Google Data Studio
- month end reporting template
- variance analysis dashboard examples
Monetization Angle
Dashboards enable higher-value bookkeeping packages (reporting + insights). Clear reporting improves retention and supports advisory upsells.
Pros
- Free and flexible.
- Professional client-facing reporting.
- Scales across many clients.
Cons
- Requires clean data inputs.
- Setup takes time.
- Not an accounting system—only reporting.
Who Should Use This
Bookkeepers who want to add recurring reporting and advisory-style insights to client services.
Who Should Skip This
Skip if clients only want basic bookkeeping deliverables and won’t maintain consistent data exports.
Practical Applications
- Build a client-authorized financial view with labeled dates and sources.
- Reconcile sample dashboard figures with underlying records.
- State assumptions and known data gaps alongside the report.
Important Considerations
- Verify current connectors, access, data freshness, feature limits, and costs.
- A dashboard does not establish accounting correctness, tax treatment, or causal business conclusions; protect financial information and validate calculations and comparisons independently.
Related Resources
Syft Analytics — advanced financial dashboarding and KPI reporting
Looker Studio — flexible reporting dashboards for client data
Related Side Hustles
 Consulting: Get Paid for What You Know — upsell advisory and KPI reviews
 Newsletter Monetization: Get Paid to Write About What You Love — report list growth and sponsor metrics
 Social Media Management — reporting supports client retention